• Blog
  • Design Portfolio
Menu

5 things I learned today

  • Blog
  • Design Portfolio
×

A BBC Football Commentator's Gorgeously Hand-drawn Match Notes To Make Designers Drool

Ryan Nance August 24, 2016

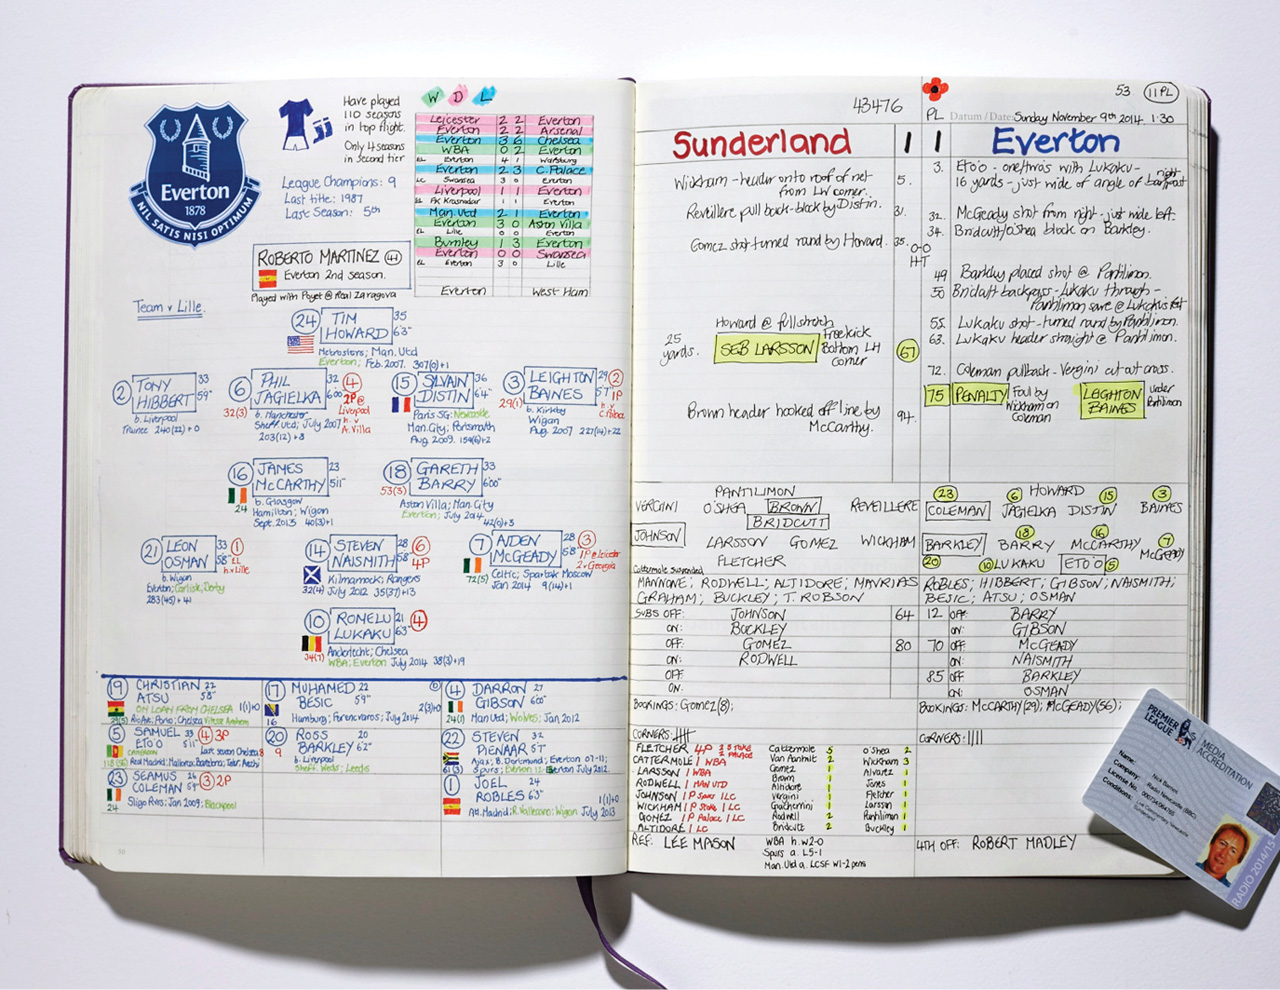
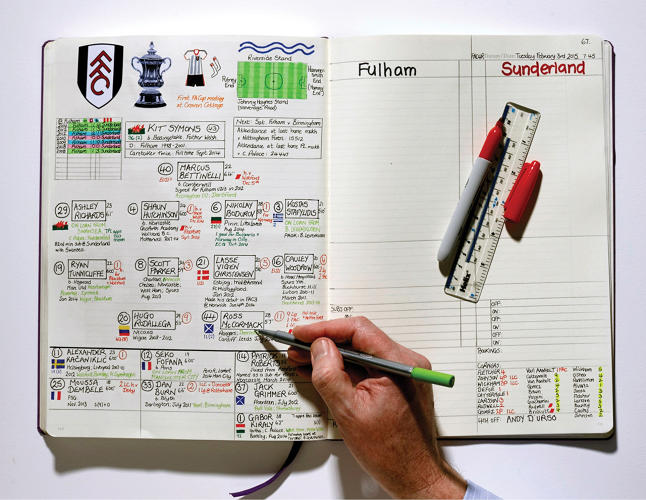
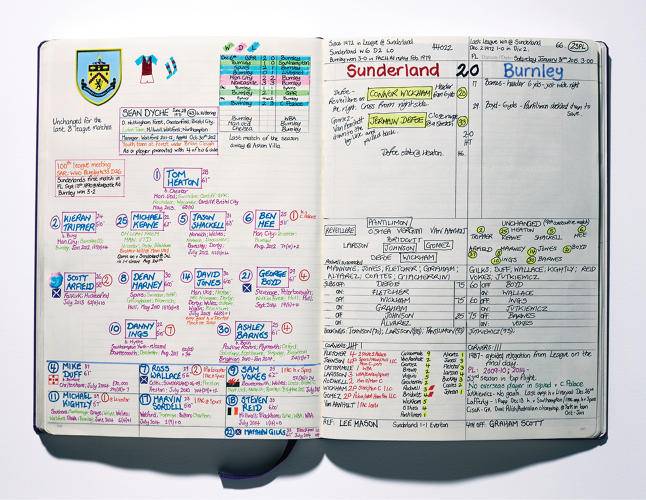
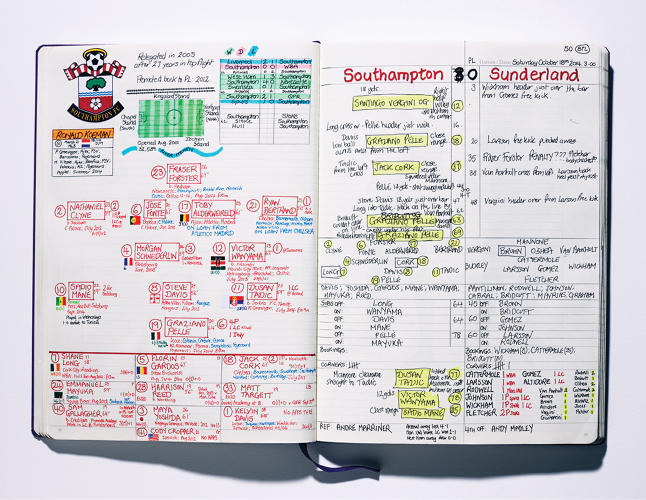
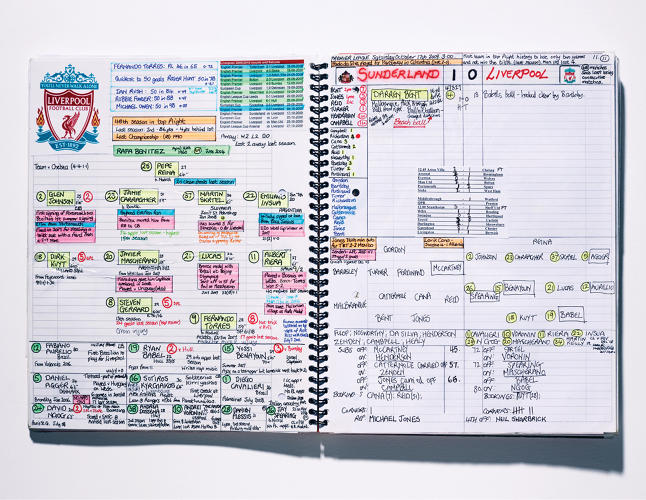
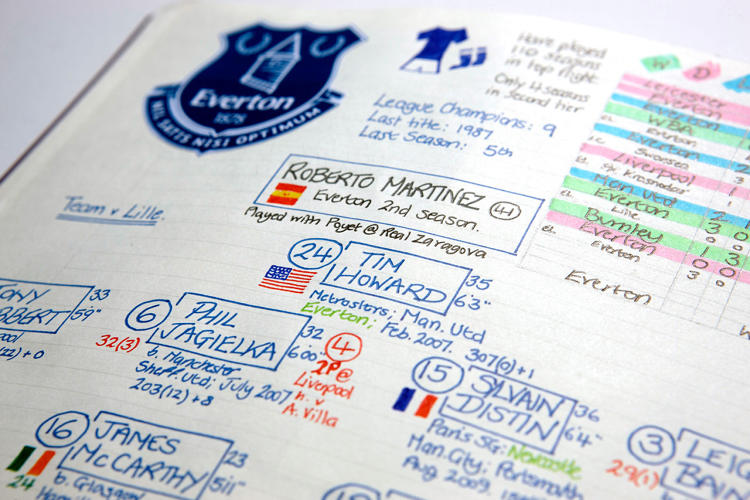
Over on Eight by Eight there's a focus on the gorgeous hand-drawn match notes prepared before every match by BBC Radio Newcastle’s Nick Barnes. From the impeccable hand lettering to the crest of the opposing team, I am equally inspired and envious of his deft, emblematic and downright stunning notes. Just check out the tiny flags he inflects each of the opposing player's with.

He says he rarely refers to them during the match, but it's not surprising that after employing  such attention in their creation, he wouldn't need to.


3046336-slide-s-6-peek-inside-the-gorgeous-notebooks-cheatsheetwebnick6.jpg
3046336-slide-s-5-peek-inside-the-gorgeous-notebooks-cheatsheetwebnick5.jpg
3046336-slide-s-4-peek-inside-the-gorgeous-notebooks-cheatsheetwebnick4.jpg
3046336-slide-s-3-peek-inside-the-gorgeous-notebooks-cheatsheetwebnick3.jpg
3046336-slide-s-2-peek-inside-the-gorgeous-notebooks-cheatsheetwebnick2.jpg
3046336-slide-s-8-peek-inside-the-gorgeous-notebooks-cheatsheetwebnick8.jpg
In 5tilt Tags design, drawing, football, information, sketchnotes
prem.png

Dynamic English Premier League Results Map

Ryan Nance October 28, 2013

Just a little Google Spreadsheet I put together because I wanted to be able to get a sense of the whole league at a glance. 

Streaks (of 3 or more) are represented by brighter colors.  

A=Away games. 

See the dynamic version here » 
In 5tilt Tags design, information, premier league, football, soccer, stats
Washington_0.JPG

The Racial Dot Map - One Dot Per Person for the Entire United States

Ryan Nance August 14, 2013

Dustin Cable, a demographer at the University of Virginia's Weldon Cooper Center for Public Service draws a dot for each person in the United States based on the 2010 census and colors by ethnicity. The project is called the Racial Dot Map.

"This map is an American snapshot; it provides an accessible visualization of geographic distribution, population density, and racial diversity of the American people in every neighborhood in the entire country. The map displays 308,745,538 dots, one for each person residing in the United States at the location they were counted during the 2010 Census. Each dot is color-coded by the individual's race and ethnicity. The map is presented in both black and white and full color versions. In the color version, each dot is color-coded by race."

See the full Map »


via Flowing Data
In 5tilt Tags demographics, infographic, information, cartography

The Vatican Explained

Ryan Nance April 27, 2013

CGPGrey Coffee Mug! http://goo.gl/hT2Dt Blog: http://www.cgpgrey.com/blog/vatican-city-explained

Seems a much more logical explanation than James Tate's How the Pope is Chosen and fun like this video series' other The Secret City of London.

Vatican-11-600x337.jpg
via 22 words
In 5tilt Tags videos, information, history, countries, vatican city

©2021 Ryan Nance