• Blog
  • Design Portfolio
Menu

5 things I learned today

  • Blog
  • Design Portfolio
×
1670915-inline-lost-infographic-503.jpeg 1670915-slide-lost-infographic-502.jpeg 1670915-inline-lost-infographic-500.jpeg

1 - Charting All of LOST

Ryan Nance October 4, 2012

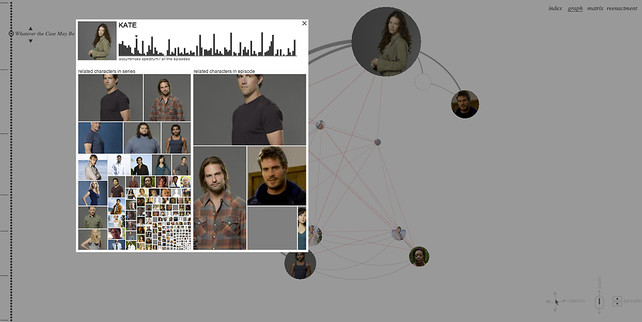
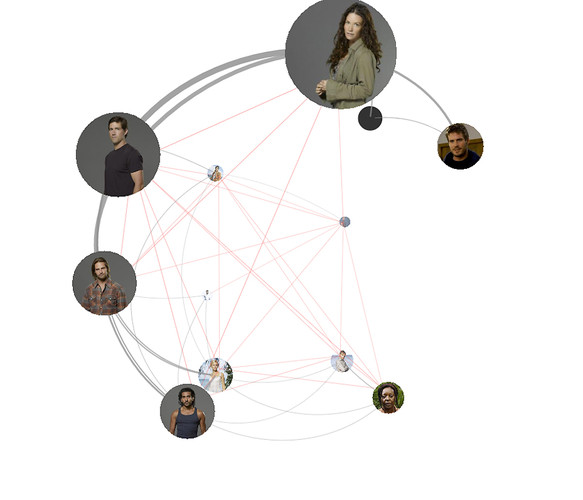
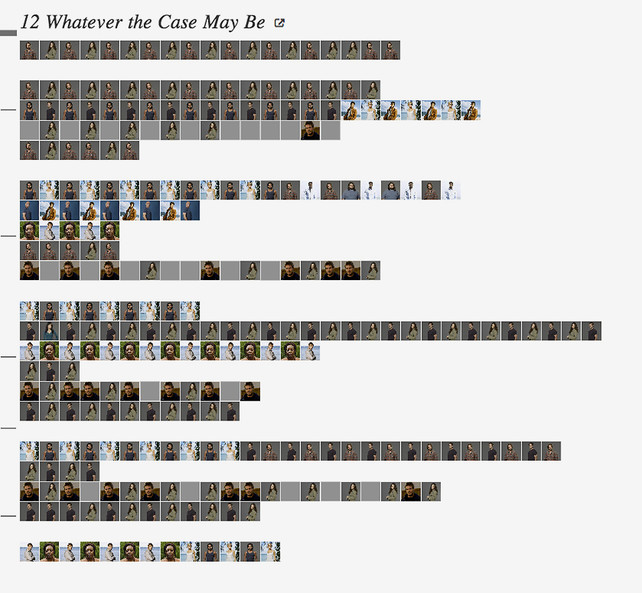
“I think the ultimate motivation is to continue enjoying something that has already finished. Lostalgia…. On the other hand is a research about how information visualization can be used to tell stories,” Ortiz, the creator of the visualization tells us. “That idea (infoviz as storytelling tool) is not new at all, but in this project the use of storytelling is much more obvious because it’s actually a story re-telling (with summit in the view mode called 'reenactment’).”

View the Project: LOSTALGIA​

via Co.Design

Recent Posts​

Blog
Unpublished Color Photos from WWII War Photographer Robert Capa
about 6 months ago
Geospatial Mappings of Tides and Salt
about 6 months ago
Flat Pack — Travel Stuff I Love
about a year ago
Stream the Globe Theatre's Productions of Shakespeare's Greatest Plays
about 5 years ago
Dark Side of the Moon - The Moon Caught Transiting The Earth
about 5 years ago
Explore 5 of Our National Parks Virtually
about 5 years ago
In 5tilt Tags LOST, tv, infographic, tv shows

©2021 Ryan Nance