Ryan Nance
Product Design
Creative problem solver with the ability to articulate in a clear and compelling way a vision of a surprising and successful user experience.
—
Recent Products
Case Studies
EDO Ad Engage
problem
EDO’s proprietary ad performance metric wasn’t easily accessible, understandable or presented flexibly enough for our clients to use widely in their business uses.
process
In discovery, we interviewed current users and potential customers to create a ranked inventory of use cases, and we began a design strategy process to identify key functional and experiential aspects to focus on.
We developed three main information architecture and app paradigm approaches, prototyping each in several discrete rounds to validate with users. We then partnered with the engineering team to plan work and rollout. We launched a beta version to a portion of users in June and conducted an ongoing series of interviews, observations and research to hone the product to our clients’ needs.
outcome
AdEngage was launched to all existing clients in October 2020, unlocking new comparison features, allowing for self-direct data analysis and laying the foundations for scaling pilot programs 10X.
Atom Tickets iOS & Android App redesign
problem
As Atom Tickets scaled up to theater coverage rivaling Fandango, data showed that the first version of the mobile app underperformed on conversion, engagement, retention and revenue.
process
With customer behavior data in hand, we first set about diagnosing possible contributing factors. We ran a few in-app experiments to test the signal, and with a strong signal, we sketched out a handful of visions, thoroughly prototyping and user testing each of them, before designing and speccing all the flows and every element of the UI.
outcome
The redesigned the iOS & Android apps for Atom Tickets with an eye towards greater retention, higher engagement (even in non-purchase sessions) and an experience that honors our customers' love of the movies resulted in the first quarter in an 18.25% increase in checkouts, a 3.13% increase in orders, a 3.75% increase in accounts created and a 111% increase in trailer views.
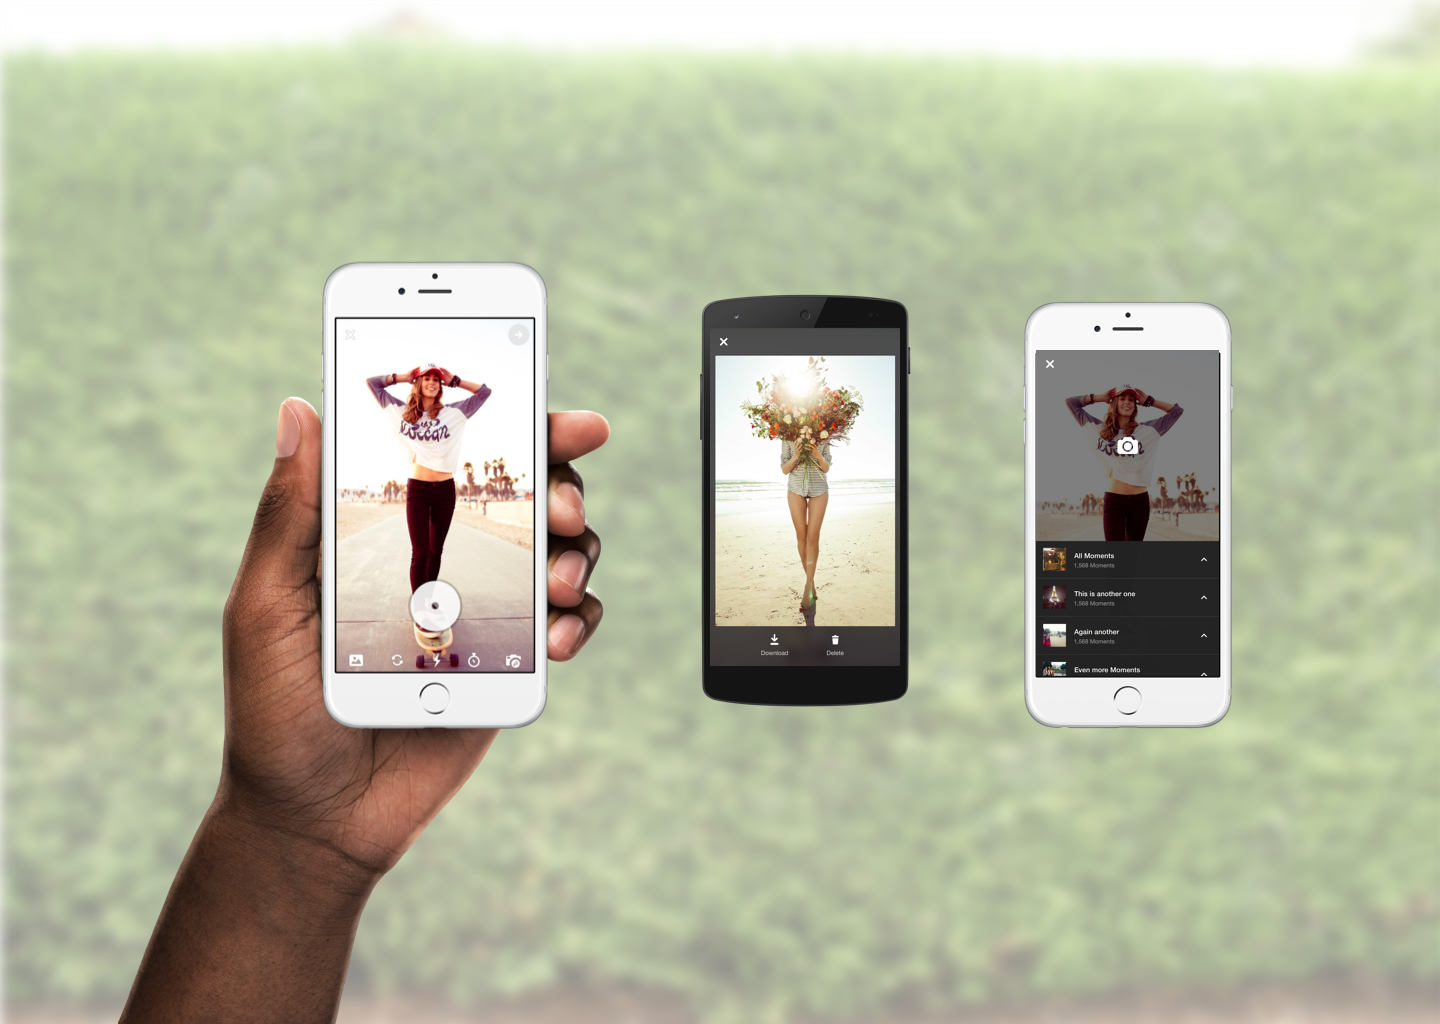
Flipagram In-App Camera & Video Maker
problem
Flipagram had an enormous user base as a media creation tool, but wanted to crack into the space of social networks as a space for discovery, interaction and engagement.
process
Conducted user research with representative users from both the high, middle and low engagement segments to uncover any aspects for their use that were inhibited by a feature or lack of feature. An early prototype of an in-app camera, capture and creation of media showed positive results. We a/b tested the two main candidates for the experience with a size-able portion of users and then released the clear winner to all 90 million users.
outcome
The release of the camera led to an 8.5% increase in 7-day retention and 121% increase in average posts per user among retained users, as well as 45% increase of session length.
Seller’s Closet on Tradesy
problem
With an ever-growing inventory of items for sale on Tradesy, many sellers were getting overlooked and we hadn’t equipped them to collect, promote or optimize their sales efforts.
process
When pouring over the data, there was a strong correlation between the number of items a seller listed and both their rate of retention and their success selling. The first inflection point was between 4 and 6 items. But most new sellers would only list 1 or 2 items as a test. So, we looked for a feature that would encourage sellers to list more and give them more payoff for that additional effort. We decided to focus on revamping the seller’s profile as a closet, a virtual store they would be nudged to fill in.
outcome
With the roll out of the closet feature, the average number of items listed per seller increased 4.75% in the first quarter and had a similar rate of increase onward. The average sales per seller also increased by 3.85%.
“ I worked closely with Ryan at Flipagram. As I was Head of Mobile and Ryan was our Head of Product Design, it was imperative that we be in sync, which was easy to do with how open and articulate Ryan is. In particular, I loved his design process— the best I have worked with in my professional career. He strikes a great balance between exploration and execution, and allocates appropriate time and processes to each. Ryan is a person I would love to work with again in any capacity.”
Alex Powell
Academy award-winning animation software architect and creative mobile app developer
“For the past year I had the pleasure of working with Ryan on a many number of projects for both the web and mobile. A true systems designer Ryan was able to help me and the engineering team build usable and delightful solutions for our users. As a team member Ryan was a no nonsense guy who was able to help folks not only understand what they wanted but why they wanted it.”
Adrian Phillips
Product Design Leadership @ Asana
Writings & Ideas
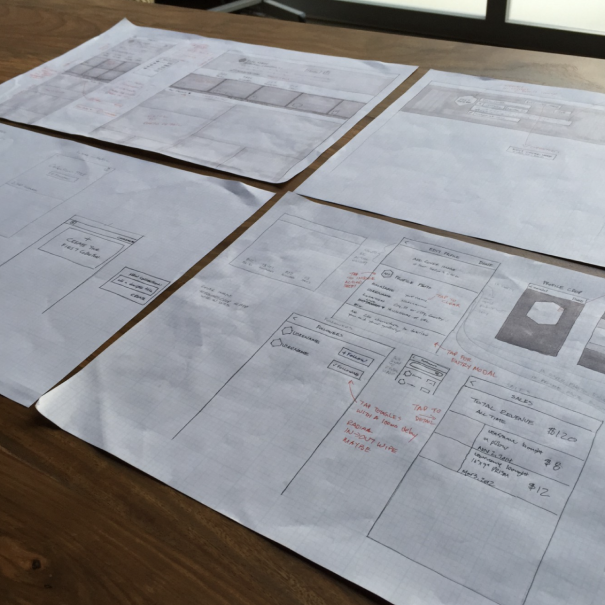
Designing By Hand in the Digital Age
Pencil first. Pixel later. The tools and tips for great sketches.
Clarity in the Details: Design UI with More Dimensions
Information as all the differences that make a difference
Design UI: Don’t Punish The Humans
Remember the limits of Human Memory
Design UI for Recognition More than for Reading
“Your brain,” James Montalbano concluded, “knows the shape of the word.”
“Ryan is a super talented design leader with an ability to communicate and align teams around solving hard problems. He asks great questions to get to a solid understanding of mental model and UX which produce the right UI solutions. His deep understanding of the design process and the mobile space made it comfortable for our team to produce work that we believe in. I would love the opportunity to work with Ryan again and would recommend him to anyone looking to build great mobile experiences”
“At Pandexio, Ryan guided us through builds on multiple platforms, which we would have completely messed up without him. And while his design work was fantastic — even when sketched on a bar napkin — it was his wisdom and insight that we appreciated the most. The most common solution to the problems we encountered was a phone call to Ryan. I hope I get the opportunity to work with him again soon.”


